Printable Log Graph Paper (Free PDF)

Properly spaced logarithmic rulings — semi-log for exponential data, log-log for power laws.
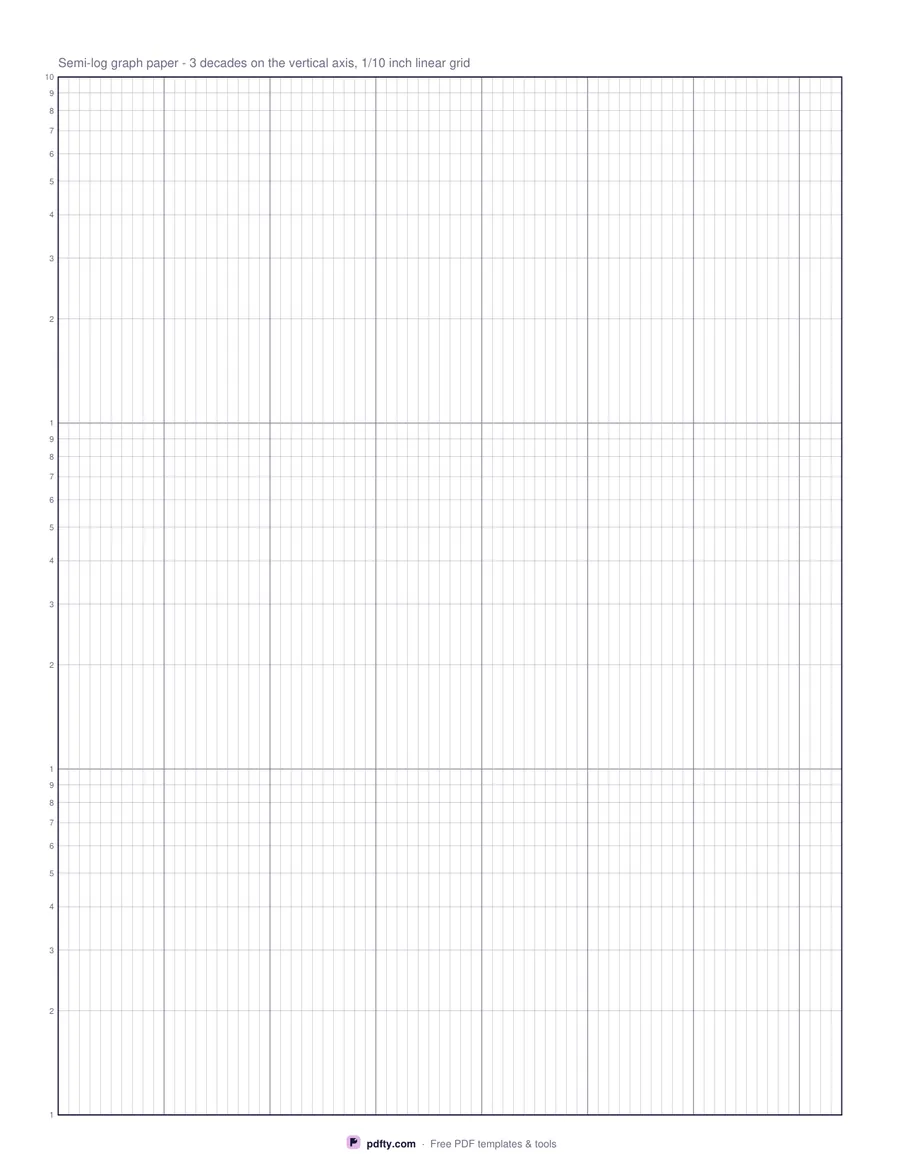
Printable semi-log graph paper with three labeled decades
Scale
Paper size
Edit free online

Free · no watermark · no sign-up for your first 20 downloads a day

On log paper the lines inside each decade are not evenly spaced: the gap from 1 to 2 is far wider than the gap from 8 to 9, because each line sits at the logarithm of its value. That is the whole point — plot exponential data on it and you get a straight line. Every ruling here is placed at its true log position, and each line from 1 to 9 is labeled so you can read a value off the page without counting.

The semi-log sheet has three decades up the vertical axis and a linear horizontal grid at 1/10 inch, with a heavier line every inch. Use it for growth and decay, half-lives, pH, sound levels, bacterial counts and anything that spans several orders of magnitude on one axis only. Straight lines on it mean exponential behaviour, and the slope gives you the rate.

The log-log sheet is a 3 cycle by 4 cycle grid with square decades, so a straight line's slope reads directly as the exponent of a power law. It suits calibration curves, frequency response, particle size distributions, scaling laws and Bode-style plots. Both sheets are plain vector pages with a dark frame around the plotting area and nothing to fill in on screen.

How to use it

  1. 1

    Choose semi-log or log-log

    Semi-log when only one axis spans decades; log-log when both do.

  2. 2

    Pick the paper size

    US Letter or A4 — the decades are recalculated to fill the sheet.

  3. 3

    Download the PDF

    One page with the plotting area framed and the decade lines labeled 1 to 10.

  4. 4

    Print at actual size

    In the print dialog choose "Actual size" or 100% instead of "Fit to page", so every measurement on the sheet comes out exactly as labeled.

Frequently asked questions

Yes. There is no watermark and no sign-up for your first 20 downloads each day; after that a free account keeps downloads going. You may print the file as often as you like for personal, school or business use.
The semi-log sheet has 3 decades on the vertical axis. The log-log sheet has 3 decades across and 4 up, with square decades so slopes read as exponents.
They label the lines inside each decade. You choose what each decade stands for — 1 to 10, 10 to 100, 0.01 to 0.1 — and write your own values in the margin.
Because it is logarithmic. The line for 2 sits about 30% up the decade and the line for 5 about 70%, which is what makes exponential data plot as a straight line.
Yes. Use the log-log sheet for magnitude against frequency, or the semi-log sheet when phase is plotted on a linear axis.
It is a plain linear grid at 1/10 inch with a heavier line every inch, so you can scale time or another linear variable across the page.

More free templates

Work with your PDF