Printable Gantt Chart (Free PDF)
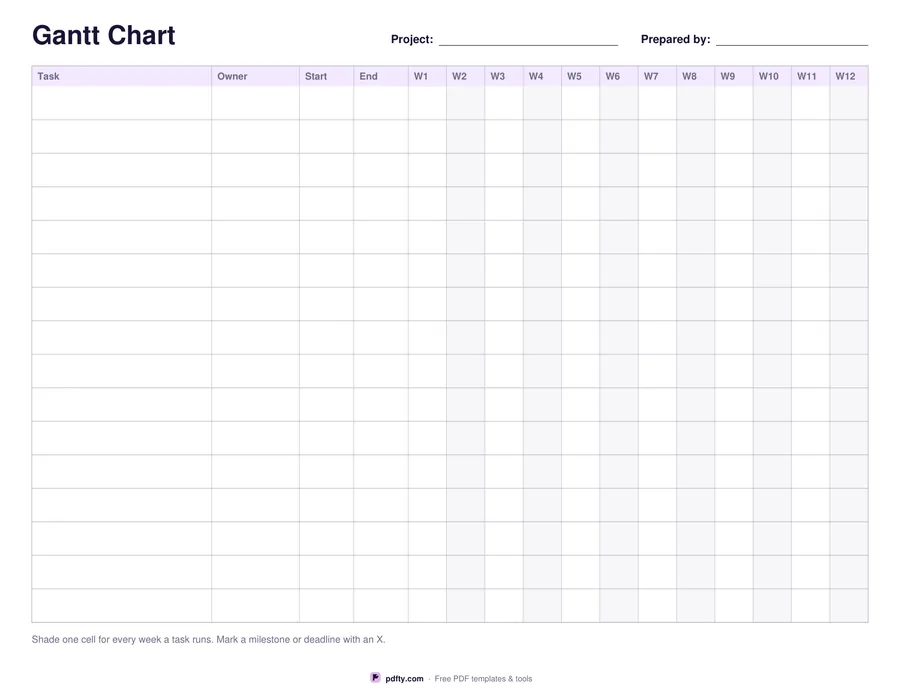
A blank project timeline: sixteen task rows against eight or twelve week columns, ready to shade in by hand.
Free · no watermark · no sign-up for your first 20 downloads a day
Fillable PDF — type into the fields online or in any PDF viewer before printing.
Each row is one task. The four left-hand columns record what it is, who owns it, when it starts and when it ends; the week columns to the right are where the bar goes. Alternate weeks carry a very light tint so you can count across to week nine without losing your place, and the cells are deliberately empty of form fields because a bar drawn across four cells with a highlighter says more than four separate ticks.
Choose eight weeks for a short delivery or twelve for a quarter. Eight weeks gives each column about 50 points of width, twelve gives about 33, and in both cases sixteen task rows fill the page at roughly 29 points each — enough to write a task name legibly and still shade a clean bar. The task column takes about a fifth of the width, which fits a real task name rather than an abbreviation.
The task, owner, start and end cells are fillable, so you can type the plan in a PDF viewer, print it, and mark the bars in the meeting. A line under the grid reminds everyone of the convention: shade one cell per week a task runs, and mark a milestone or a hard deadline with an X. One landscape page, US Letter or A4.