Cause and Effect Chart (Free Printable PDF)
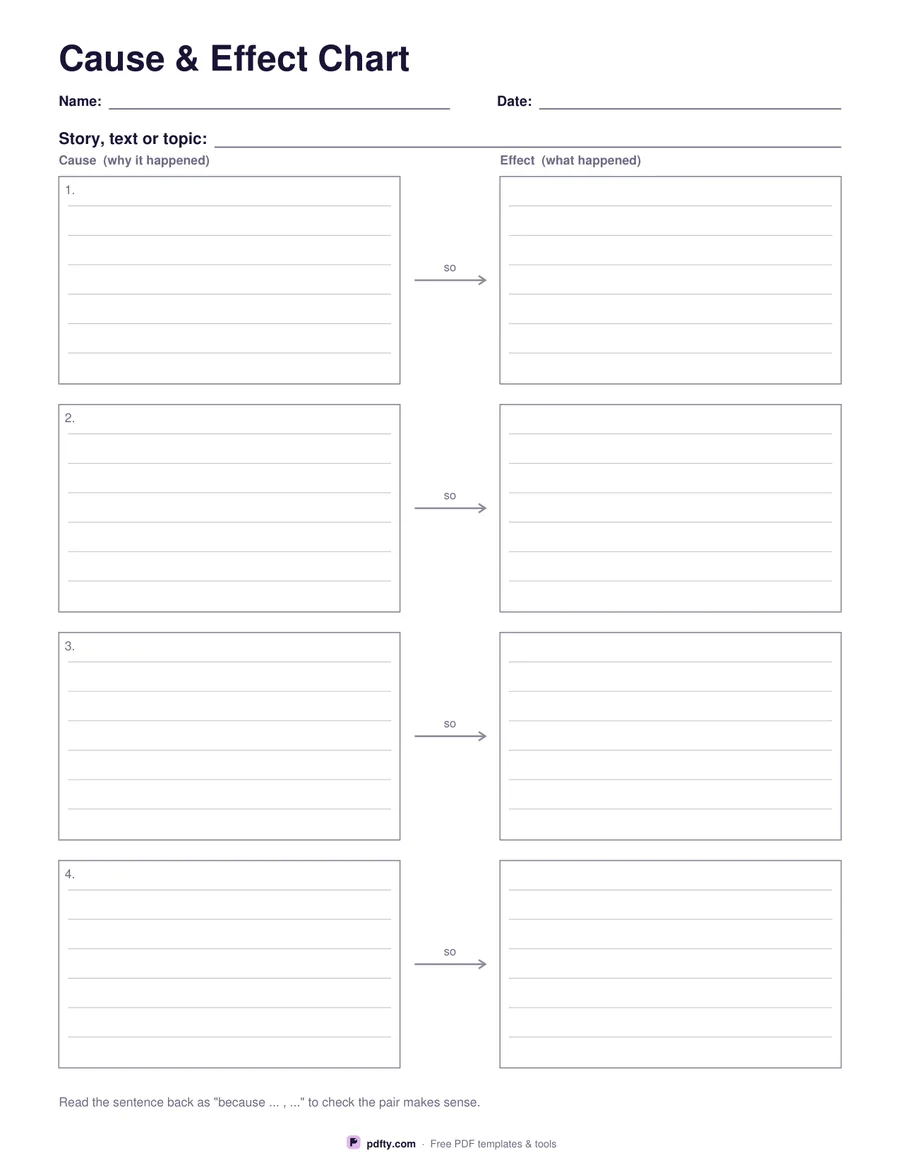
Paired boxes joined by an arrow: write what happened on the right and why it happened on the left.
Free · no watermark · no sign-up for your first 20 downloads a day
Fillable PDF — type into the fields online or in any PDF viewer before printing.
Cause and effect is easier to see than to explain, so this organiser puts the two halves side by side. Each row is a cause box on the left and an effect box on the right, joined by an arrow with the word so on it, which makes the sentence read itself: this happened, so that happened. A topic line at the top records the story, text or event the chart is about.
The pairs option sets how many rows you get. Three gives tall boxes for younger writers who need room for large handwriting, four is the everyday choice, and five fits a longer chain of events from a chapter or a history lesson. Each box is ruled with light lines, and the numbers down the left keep the rows in order when they are discussed together.
All the boxes are multi-line form fields, so the chart can be typed and printed or filled in by hand. A line under the chart suggests reading each pair back as a because sentence to check it makes sense, which catches the common mistake of writing two things that merely happened near each other. The topic line and the numbered rows mean several charts can be kept together without losing track of which text each belongs to.