Blank Bar Graph Worksheet (Free Printable PDF)

A tally table and an empty bar chart on one page, so a class survey can be collected and graphed on the same sheet.
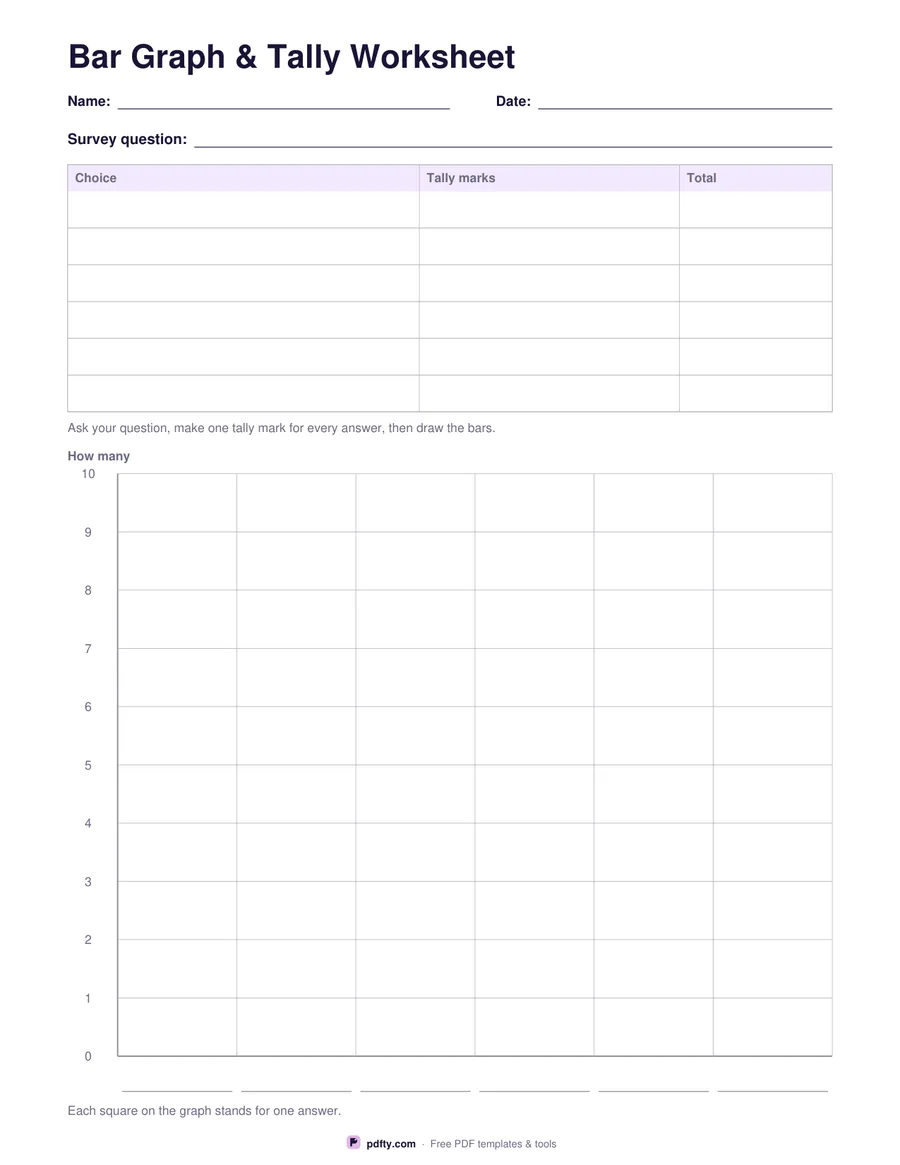
Printable blank bar graph worksheet with a tally table
Categories
Paper size
Fill & edit free online

Free · no watermark · no sign-up for your first 20 downloads a day

Fillable PDF — type into the fields online or in any PDF viewer before printing.

This is the sheet for the lesson where children ask a question and graph the answers. The top line is for the survey question itself. Under it is a tally table with a row for each choice, a wide column for tally marks and a totals column, so the counting happens before any drawing begins. Nothing on the sheet is filled in for the child: the data comes from their own class, playground or family survey.

The bottom two thirds of the page is an empty bar chart with a grid scaled from zero to ten and a label box under each column. Because the grid squares are drawn, bars can be coloured in square by square and the height read straight off the axis, which is what most first graphing lessons ask for. Four categories gives wide bars for younger children; six fits a longer list of choices.

The question, the table cells and the column labels are all form fields, so a teacher can type the question and the choices before printing a class set, leaving only the tally marks and the bars to be done by hand. Nothing is pre-printed in the graph area itself, so the same sheet works for favourite fruit in first grade and for a science tally in fifth. The sheet prints on one page in US Letter or A4.
How to use it

  1. 1

    Choose how many choices

    Four for wide bars and a short list, six when the survey has more answers.

  2. 2

    Type the question and the choices

    Fill the survey question and the choice names on screen before printing a class set, or leave them blank to write by hand.

  3. 3

    Print or fill it in

    Print at 100% ("Actual size") so lines and boxes keep their exact spacing, or fill the form fields on screen in any PDF viewer.

  4. 4

    Tally, total, then graph

    Make a tally mark for every answer, write the totals, then colour the bars up to the right line.

Frequently asked questions

Yes. There is no watermark and no sign-up for your first 20 downloads each day; after that a free account keeps downloads going. You may print the file as often as you like for personal, school or business use.
The scale runs from 0 to 10 with a line at every whole number, so each square stands for one answer.
No, and that is the point: the grid and axis are printed, and the child draws or colours the bars from their own data.
Yes. The question line, the tally table cells and the labels under the bars are form fields, so a class set can be prepared and printed.
Let two squares stand for one answer and write that under the graph, or split the survey into two sheets.
Yes. Type into the fields in any PDF viewer, or open it in an annotation app and draw the bars with a stylus.

More free templates

Work with your PDF