Science Lab Report Template (Free PDF)
One page that walks a pupil through an experiment: question, hypothesis, variables, method, results and conclusion, in the order a write-up needs them.
Free · no watermark · no sign-up for your first 20 downloads a day
Fillable PDF — type into the fields online or in any PDF viewer before printing.
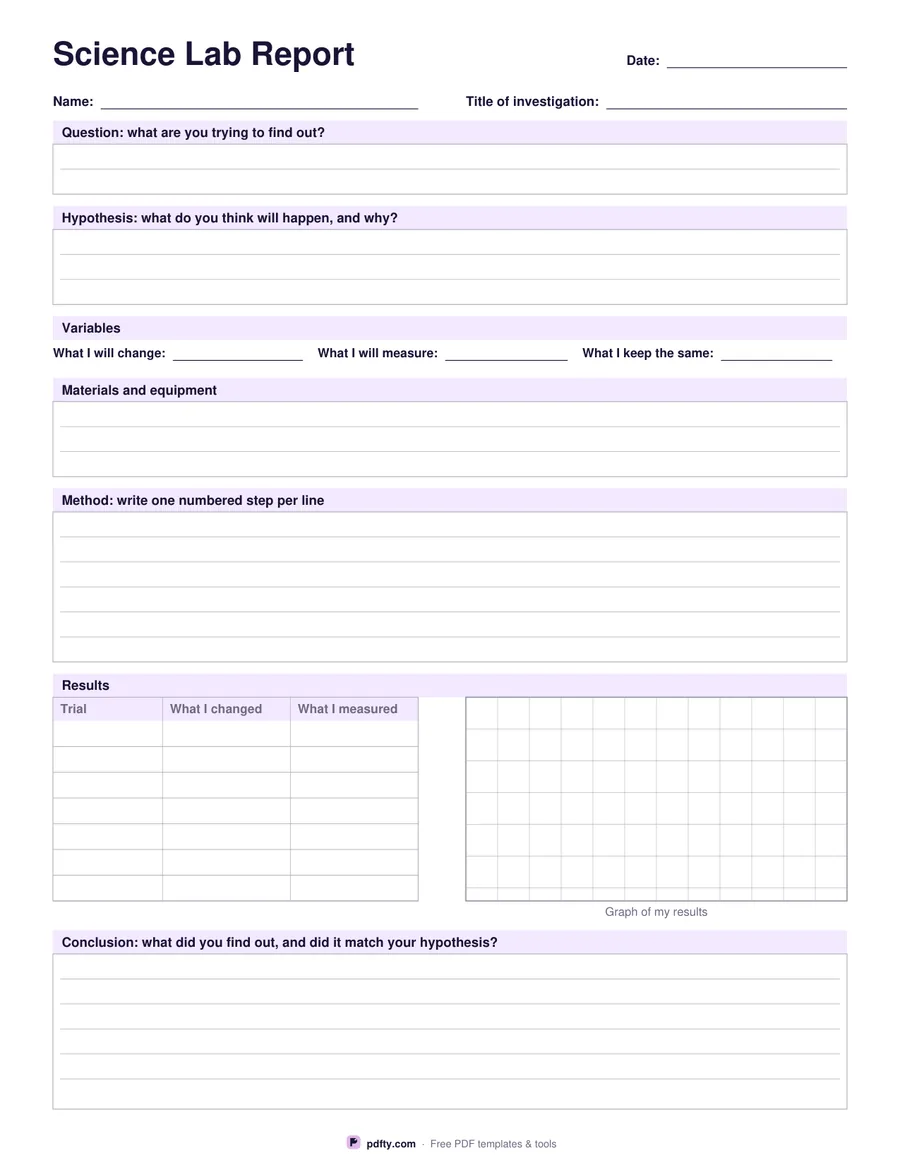
The sheet follows the shape of a school write-up from top to bottom. A name and investigation title line, then the question being investigated, then the hypothesis with its own prompt asking what the pupil thinks will happen and why. Underneath, three short lines record the variables: what will be changed, what will be measured and what is kept the same. That row is the part most write-ups skip and the part that makes an experiment fair.
Materials and equipment get a ruled block, and the method gets a taller one with a line per numbered step, which quietly encourages short instructions rather than a paragraph. The results section is a table of seven trials with columns for what was changed and what was measured, enough for three readings and an average or for a longer run of single measurements.
Choose whether to include a graph grid beside the results table. With it on, a square grid of twelve divisions sits next to the table for plotting the results by hand; with it off, the results table runs the full width of the page for longer readings. The conclusion block at the bottom asks directly whether the result matched the hypothesis. Every block is a form field, so the report can be typed and kept as a file.